


Imagine you’ve just wrapped a major rebrand. The visuals are fresh, the messaging feels right. But now leadership wants proof it was worth the investment. You open your analytics dashboard, only to find numbers that tell half the story.
That’s the gap brand metrics fill. They reveal valuable information about marketing strategies, campaigns, and your overall brand performance. They tell you how your brand is perceived, remembered, and lived across all touchpoints.
Here, we break down the key categories of brand metrics, how to measure them with confidence, and how Frontify helps teams turn brand consistency into measurable business impact.
What are brand metrics?
Brand metrics are the measurable signals that show how people feel about your brand and how those perceptions translate into business value. Unlike marketing metrics, which track short-term campaign results, brand metrics focus on long-term equity and brand perception.
The 4 pillars of brand metrics you should be tracking
There are four main pillars that each of the 17 metrics falls under. Together, they offer a complete framework for measuring your brand effectively.
Pillar #1: Reach & awareness
Reach and awareness metrics measure how familiar your target audience is with your brand. They reveal how visible you are in the market and how effectively your brand marketing efforts build brand recognition.
1. Aided brand recall: This tells you whether audiences can identify your brand when prompted with visual or verbal cues. For example, a survey might ask, “Which of the following software brands have you heard of?” Aided recall reflects how recognizable your brand is, even if it’s not top of mind.
2. Unaided brand recall: It measures whether people can name your brand without any cues. For instance, a survey might ask respondents, “When you think of brand management software, which brands come to mind?” Unaided recall is a strong predictor of purchase consideration because it reflects true salience: your brand is the first people think of in a given context.
3. Share of search: How often people look for your brand compared to the total search volume for your category. Use this calculation:
Share of search = (Branded search volume ÷ Total category search volume) × 100
For example, if searches for “Frontify” total 4,000 per month and the total number of searches for “brand management software” equals 20,000, Frontify’s share of search is 20%. Increases in share of search often mean gains in market share, making it a powerful leading indicator of brand strength.
4. Branded keywords: If people are searching for your company name or products specifically, that indicates a high level of brand awareness. Tracking how many branded keywords you rank for — and where you rank — helps you see whether more people are actively seeking out your brand versus your competitors.
5. Reach and impressions: This measures how many people have seen your brand content across channels. These metrics help track visibility trends, but they shouldn’t be treated as stand-alone indicators of success. Use them as context alongside more predictive metrics like recall and share of search to understand awareness across the customer journey.
Pillar #2: Trust & health
6. Brand sentiment: Track the tone of conversations about your brand across digital channels. Many social media platforms integrate with listening tools that include sentiment analysis functionality, so you can easily track how people feel about your brand, products, and service. Categorize mentions as positive, neutral, or negative, to understand whether your brand’s reputation is improving or eroding over time. Combine automated social-listening insights with qualitative analysis from customer feedback and reviews.
7. Brand preference: Measure how many people actively choose your brand when given a choice. You can capture it through surveys that ask questions such as, “Which brand is your first choice when selecting [category]?”
8. Net Promoter Score (NPS): Quantify trust and advocacy through a single, widely used metric. To calculate it, ask customers, “How likely are you to recommend our brand to a friend or colleague?” on a 0–10 scale. Then apply the formula:
NPS = % of Promoters (9–10) − % of Detractors (0–6)
Scores above +50 indicate strong brand loyalty and advocacy; scores above +70 are considered excellent.
9. Brand associations: The traits people connect with your brand, such as innovative, trustworthy, sustainable, or customer-focused. Track associations through open-ended survey responses, focus groups, or AI-powered text analysis that identifies recurring themes in customer language.
Pillar #3: Business impact
Business impact metrics show how your brand drives measurable growth.
10. Conversion lift: Compares performance between branded and generic traffic. If visitors who search for your brand name have a 4% conversion rate versus 2% for non-branded keywords, that 2-point difference is your conversion lift.
11. Pricing power: Measures how much more customers are willing to pay for your brand over a comparable alternative. Use the formula:
Pricing Power = (Brand Price − Generic Price) ÷ Generic Price × 100
If you can sell your branded product for $120 while a similar generic product costs $100, your pricing power is 20%.
12. Customer lifetime value (CLV): CLV tells you how much long-term revenue your brand generates per customer. The formula is:
CLV = (Average Purchase Value × Purchase Frequency × Customer Lifespan)
For example, if customers spend $200 twice a year for five years, CLV equals $2,000.
13. Market share: This captures your brand’s slice of the total category. The calculation is your brand’s sales divided by total market sales. In B2C contexts, it reflects consumer demand; in B2B, it shows competitive positioning and contract win rate.
Together, these metrics quantify how brand equity becomes business value with stronger margins, repeat and loyal customers, and sustainable growth.
Pillar #4: Consistency & engagement
Consistency is the best indicator of how deeply people across your organization engage with it.
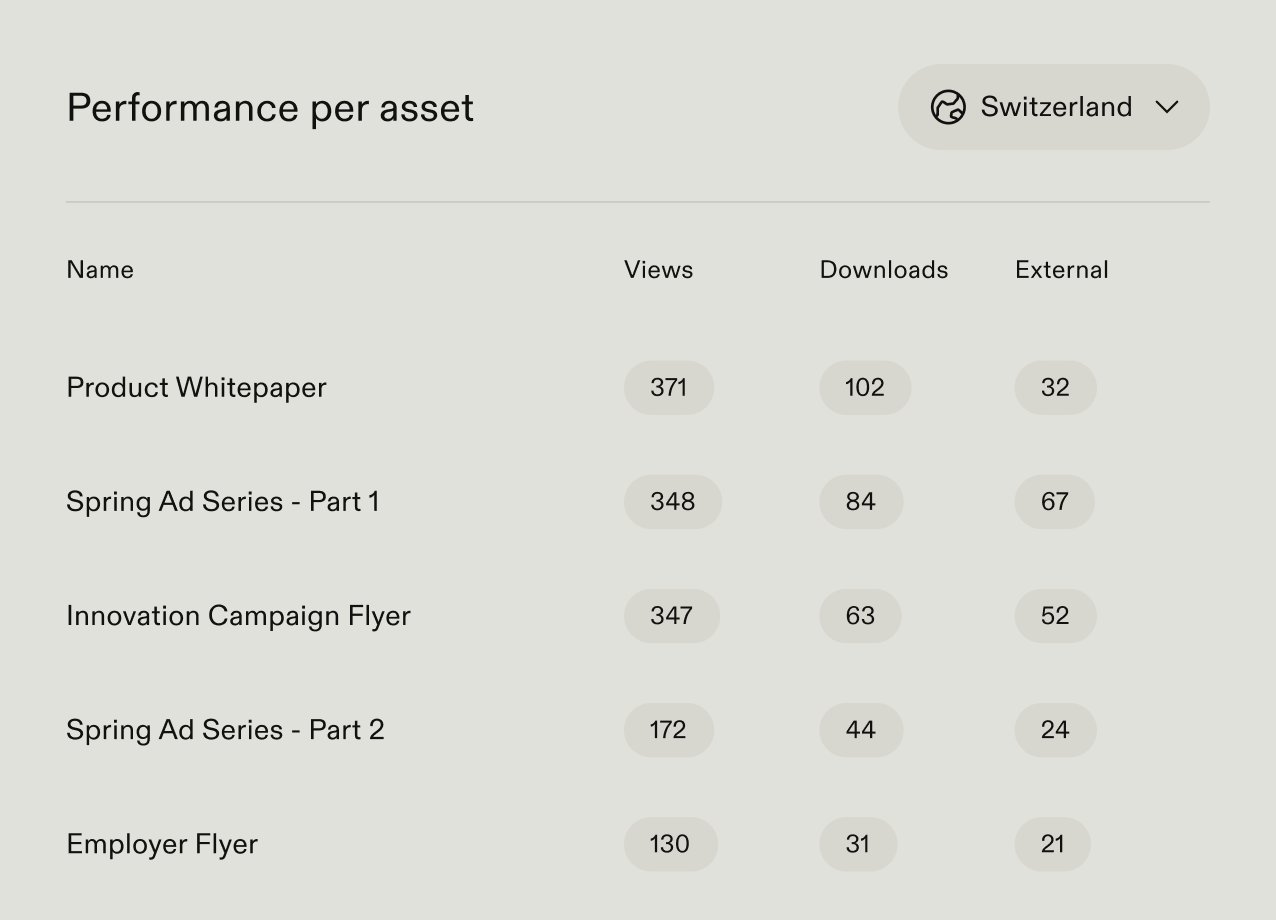
14. Brand asset reuse: Tells you how often teams use existing, approved materials instead of recreating them from scratch. If employees are using your brand assets in their work, that signifies high levels of brand engagement. They feel empowered to use brand materials and know where to find them. Track reuse through your digital asset management (DAM) analytics to see how assets circulate across teams and regions.
15. Template usage compliance: This shows whether teams are applying your templates as intended. Use your DAM or brand platform to track template use, making it a key performance indicator (KPI) for brand consistency.
16. Asset downloads: See how this changes over time to understand how levels of brand engagement are changing within the company. If brand engagement levels are growing, you should see an increase in asset usage over time as more people and teams start using your brand assets in their work. Pair download data with user analytics to identify your power users and spot teams that need more onboarding or support.
17. Internal brand alignment: Track how deeply your people understand and apply your brand. Metrics like guideline adoption rates, training completion, and brand portal logins show how engaged your teams are with the brand’s core identity.
For example, Telefónica has over 375,000 brand assets uploaded to its Brand Portal. The portal is used more than 10,000 times per month, and its brand guidelines are viewed 80,000 times a month. This shows a very high level of internal brand engagement. Not only are Telefónica employees accessing and using its brand assets, but they’re also consulting the brand guidelines to ensure they’re using the assets and messaging correctly to improve brand consistency across the business.
Learn more about brand portals.
Common brand metrics challenges
Even the best measurement plans can fall short if the data behind them tells an incomplete story. Watch out for these common pitfalls:
- Focusing on vanity metrics: Big numbers like follower counts or impressions rarely show true brand strength. These vanity metrics overlook how people actually engage with or use your brand. Instead, prioritize actionable metrics, like brand sentiment, share of search, and NPS, that reveal how your brand performs in the real world.
- Measuring in isolation: Tracking awareness alone won’t show the whole picture. Combine data across categories (e.g., awareness, engagement, business impact) using integrated dashboards that compare results over time and against competitors.
- Ignoring internal brand metrics: Internal adoption metrics tell you how well your teams are adopting and using the brand. Track metrics like template compliance and guideline engagement to uncover how internal behavior drives external consistency. Frontify helps capture and improve these signals directly in one place.
Measuring brand metrics: step-by-step guide
Align your brand metrics with business goals to make data-driven, informed decisions that help you meet customer demands.
1. Define objectives and KPIs
Define your organization’s overall objectives and set KPIs that will help you meet those goals. Whether you’re launching a new product, rebranding, or expanding, identify the outcomes that matter most.
Set clear, measurable KPIs like, “Increase unaided awareness from 15% to 25% in 12 months.” Focus on five to seven core metrics at first; you can always add more later.
Establish baselines by capturing your current performance for each metric. Use historical data, surveys, or analytics to create a clear point of comparison for future brand growth.
2. Choose measurement methods
Pick the right mix of methods to capture a complete picture of brand performance, including surveys, analytics, CRM, and governance data. Surveys reveal perception; analytics and CRM data track behavior; and governance data from your brand platform shows how teams actually use your brand.
Combine qualitative and quantitative inputs. Qualitative data uncovers the why behind perceptions, while quantitative data reveals the what through measurable patterns in behavior, engagement, and performance.
Consider using triangulation (e.g., cross-checking multiple data sources) to validate your results.
3. Establish measurement cadence
Set a process for tracking your brand metrics so insights stay actionable. Monitor digital metrics continuously, while running brand health and awareness studies quarterly or biannually.
Align your measurement cycles with planning and budgeting to keep data relevant to when your company makes decisions. Automate reports and set alert thresholds to flag shifts early so that you can act fast, not after the fact.
4. Analyze and act on insights
Go beyond reporting the numbers: show what they mean for the business. Link every insight to an outcome, whether that’s shifting spend or investments, refining brand positioning, or scaling what works.
Use a simple “insight (metric/KPI) → action (what you’ll actually do to improve the metric) → owner” framework to drive accountability and avoid vanity dashboards that don’t lead to meaningful change. The goal is to make smarter decisions that optimize your marketing campaigns, budgets, and brand strategy.
Tools and technologies for brand metrics
A strong measurement plan relies on the right mix of technologies. These tools below work best when you use them together, pairing external perception data with internal performance insights, to give a complete view of brand strength.
- Brand tracking and market research platforms: These platforms use survey panels, brand lift studies, and competitive tracking services (e.g., YouGov BrandIndex) to capture awareness, perception, and preference over time. Use them to evaluate campaigns, benchmark against competitors, and adjust strategy based on audience sentiment.
- Digital analytics and monitoring tools: Web, search, and social media analytics reveal how audiences interact with your brand online. Combine digital metrics with survey data (from your brand tracking and research platform) to uncover why performance is changing. Add branded search monitoring, social sentiment tracking, and competitive intelligence tools to understand share of voice and category positioning.
- Brand management platforms: Governance-driven systems like Frontify unify DAM, brand guidelines, and templates to track and improve internal adoption. These tools measure compliance, consistency, and engagement so you can easily link internal brand behavior to external perception. Frontify’s AI-powered Brand Assistant even automates compliance checks and surfaces insights in real time.
How Frontify drives superior brand metrics
Unlike fragmented tech stacks and approaches, Frontify unifies every element of brand measurement into one connected ecosystem. As a comprehensive brand operations and governance system, it enables teams to measure and improve internal consistency while tracking external measurements for a complete, data-driven view of brand health.
Through built-in usage analytics, you can track how guidelines, templates, and assets are adopted and applied across teams. You’ll turn internal behaviors like asset reuse and template compliance into measurable indicators of brand consistency. Live, interactive brand guidelines make governance measurable, enabling you to monitor compliance, update standards in real time, and visualize adoption trends at a glance.
For multi-brand and global organizations, Frontify extends this visibility across markets and business units, helping brand and regional teams compare adoption, engagement, and compliance metrics to drive alignment at scale.
With Brand Assistant, all of these insights become predictive: automated checks identify off-brand usage, flag risks, and surface opportunities through AI-powered monitoring of brand health metrics and sentiment.
The result: a connected, intelligent brand operations system that strengthens your brand with every interaction.
